使用ResNet18预训练模型做推理
import torch
import torchvision.transforms as transforms
from PIL import Image
import numpy as np
import matplotlib.pyplot as plt
# 图片路径列表
image_paths = ['pic/image0.png', 'pic/image1.png','pic/image2.png','pic/image3.png','pic/image4.png','pic/image5.png','pic/image6.png', 'pic/image7.png']
# 定义预处理步骤
transform = transforms.Compose([
transforms.Resize((100, 100)), # 调整图片大小
transforms.ToTensor(), # 转换为张量
transforms.Normalize(mean=[0.485, 0.456, 0.406], std=[0.229, 0.224, 0.225]) # 标准化
#对图片进行标准化处理,使用的均值和标准差是常用于预训练模型的ImageNet参数。
])
# 读取并预处理图片
images = [transform(Image.open(path).convert('RGB')) for path in image_paths]
# 将图片列表转换为一个张量
input_tensor = torch.stack(images) # Shape: [8, 3, 50, 100]
# 定义卷积层
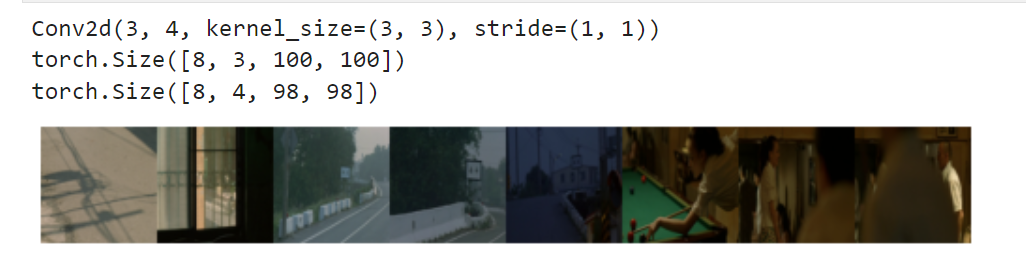
m = nn.Conv2d(3, 4, 3, stride=1)
# 应用卷积层
output = m(input_tensor)
# 打印输出
print(m)
print(input_tensor.shape)
print(output.shape)
#print(input_tensor)
#print(output)
images = [Image.open(path).resize((100, 100)) for path in image_paths]
input_img = [np.array(img) for img in images]
# 水平拼接图片
concatenated_image = np.hstack(input_img)
# 使用matplotlib显示图片
plt.imshow(concatenated_image)
plt.axis('off') # 不显示坐标轴
plt.show()
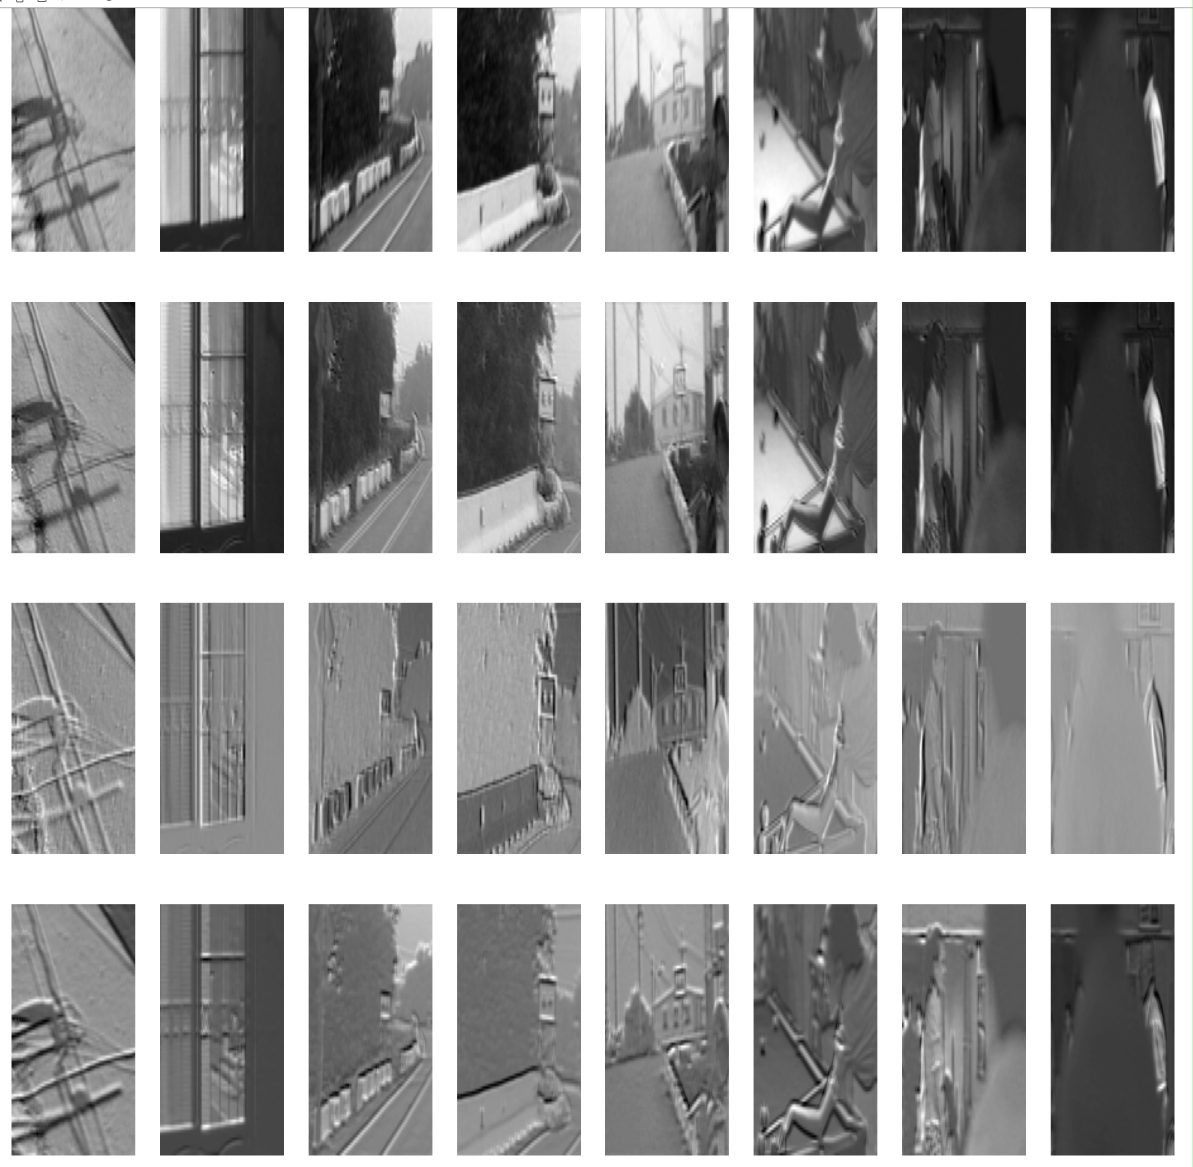
        # 转换输出张量为numpy数组,并进行适当的处理以便于显示
        output_np = output.detach().numpy()  # 转换为numpy数组
        output_np = output_np.transpose(0, 2, 3, 1)  # 重排维度为 [batch_size, height, width, channels]
        #output_np = output_np.reshape(8, 50, 100, 4)  # 确保形状正确

        # 创建一个大的画布来显示所有的特征图
        fig, axs = plt.subplots(4, 8, figsize=(10, 10))  # 创建8行4列的子图
        #figsize=(10, 20): 这个参数指定了整个图形的大小,单位为英寸。这里的10是图形的宽度,20是图形的高度。

        for i in range(4):  # 遍历每个样本
            for j in range(8):  # 遍历每个输出通道
                # 显示第i个样本的第j个通道
                axs[i, j].imshow(output_np[j, :, :, i], cmap='gray',aspect='auto')
                axs[i, j].axis('off')  # 关闭坐标轴

        plt.show()
import numpy as np
import matplotlib.pyplot as plt
from mpl_toolkits.mplot3d import Axes3D
#mpl_toolkits.mplot3d是matplotlib的一个工具包,用于生成3D图形。
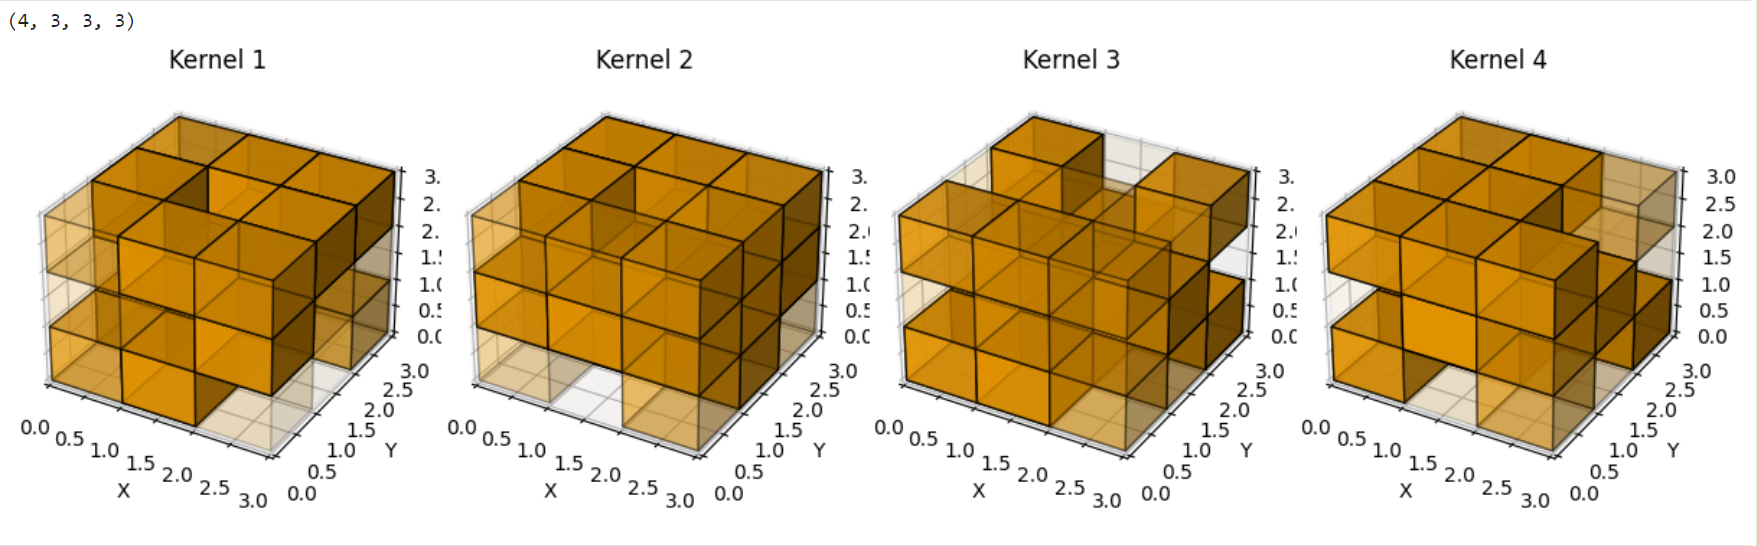
# 假设 weights 是从卷积层中提取的权重,形状为 (4, 3, 3, 3) 表示4个3x3x3的卷积核
weights = m.weight.data.numpy()
print(weights.shape)
min_val = np.min(weights)
max_val = np.max(weights)
# 归一化权重
weights = (weights - min_val) / (max_val - min_val)
#weights = np.random.rand(4, 3, 3, 3) # 使用随机数据作为示例
#print(weights.shape)
fig = plt.figure(figsize=(12, 10))
# 遍历所有4个卷积核
for idx in range(4):
ax = fig.add_subplot(1, 4, idx + 1, projection='3d')
kernel = weights[idx]
# 遍历卷积核中的每个值
for i in range(kernel.shape[0]):
for j in range(kernel.shape[1]):
for k in range(kernel.shape[2]):
# 使用权重值设置透明度
alpha = kernel[i, j, k]
# 绘制立方体
ax.bar3d(i, j, k, 1, 1, 1, alpha=alpha, color='orange', edgecolor='black')
ax.set_title(f'Kernel {idx + 1}')
ax.set_xlabel('X')
ax.set_ylabel('Y')
ax.set_zlabel('Z')
ax.set_xlim([0, 3])
ax.set_ylim([0, 3])
ax.set_zlim([0, 3])
plt.tight_layout()
plt.show()